New research has revealed the relative dwelling prices between Sydney & Melbourne and Brisbane & Perth, before, during and after the mining boom – providing some fascinating insights into the nature and course of property price movements.
The new research from RiskWise Property Review provides an answer to the questions:
- What are the long-term, ‘normal’ property prices in Brisbane and Perth, relative to Sydney’s and Melbourne’s?
- Adopting a long term perspective, does Brisbane really offer a good dwelling value, and should we expect from the Sunshine State to shine? and;
- Has Perth reached the bottom and what are the estimated dwelling prices for Perth under ‘normal market conditions’?
RiskWise Property Review has created a ratio between the relative prices in our capital cities, which can help assess the long-term price trends in Brisbane and Perth relative to prices in Sydney and Melbourne. The aim of this ratio is to leverage more than 30 years of historical perspective of dwelling prices, to better understand the fundamentals of the property markets in Brisbane and Perth post-mining boom.
Research Background
The objectives of our research, ‘Before, During and After the Mining Boom’, is to provide a long-term perspective of the housing market by assessing the relative prices of housing in Sydney, Melbourne, Brisbane and Perth.
The mining boom lasted about a decade, from 2003 until the second half of 2012. As per RBA, by mid-2012, investment in the Australian resource sector peaked at just under 8 per cent of GDP, compared with its average of around 2 per cent prior to the boom.

In the lead-up to that investment peak, growth in output, employment and wages in the resource sector was strong. The boom in those industries led to strong economic conditions in the resource-rich states of Western Australia and Queensland.
As shown below, capital expenditure plunged from 2013, resulted in a structural change to the Australian economy.

RiskWise Property Review notes that overall, demand for labour in the mining sector has a very strong correlation to the investment phase and a lower correlation with the production phase. In other words, the main driver for labour demand is investment, where higher changes to commodity prices require only a limited addition of labour.
Therefore, due to the decline in the capital expenditure, mining-related employment has contracted and wage growth in those industries has declined, to be noticeably below that of other sectors. Also, increased commodity prices (not accompanied by a significant capital expenditure) is projected to have only a little impact on the labour market.
Part One – Median House Prices and Capital Cities against median Australian Property Prices
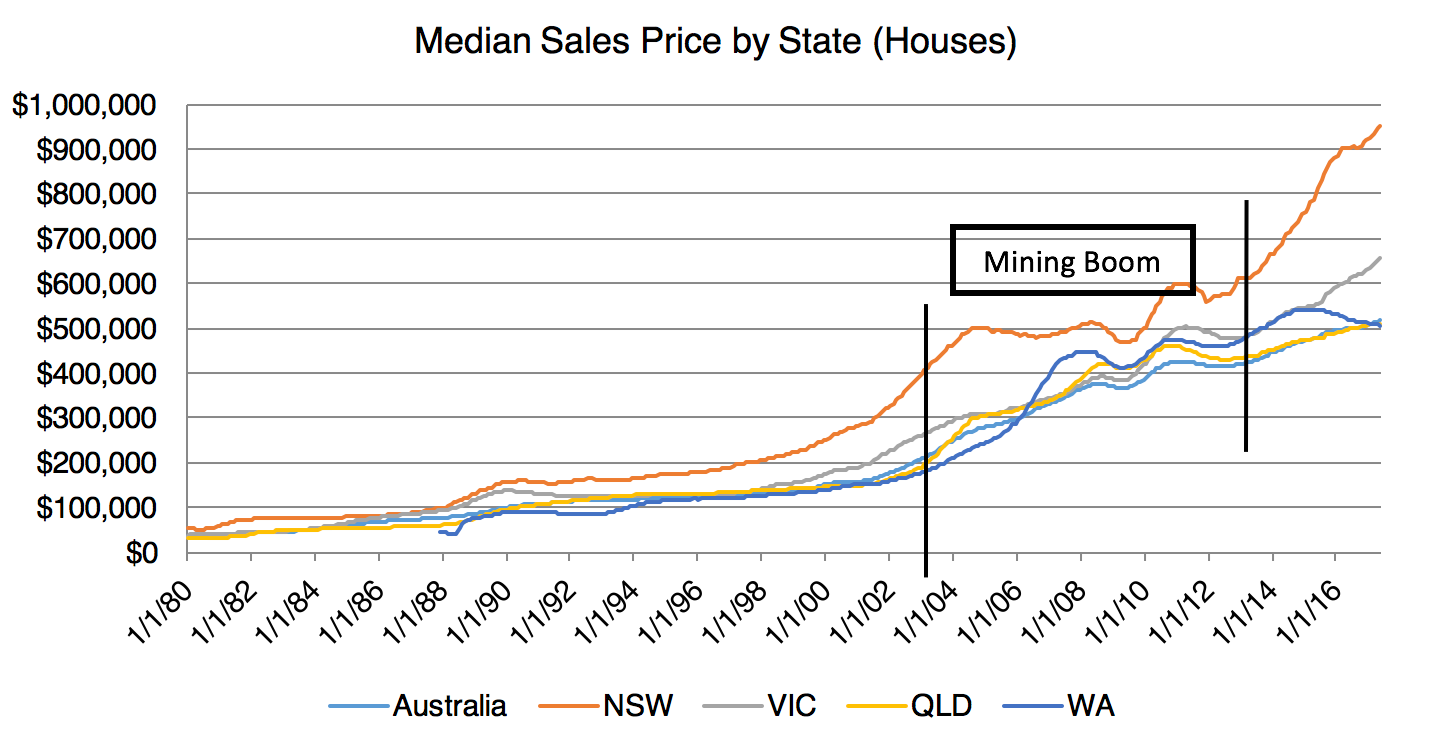
Note: To eliminate distortions due to the current oversupply of units across the country, we have conducted our research on houses only, as opposed to overall dwelling prices.

Results – Houses

Where would property prices be today?
If the mining boom never happened, what were property prices tracking towards?


Commentary:
- The current prices in both Perth and Brisbane are very similar to the long-term price projections for these states.
- The current prices in Melbourne are 13% higher than the long-term ratio, reflecting the positioning of Melbourne as a prime capital city post the mining boom.
- The current prices in Sydney are 31% higher than the long-term ratio – this is significantly higher than the long-term trend.
- Therefore, a very significant gap has been created between Sydney & Melbourne relative to Brisbane & Perth – see below a detailed comparison analysis between these four capital cities.
- Post-mining boom, the gap between Sydney & Melbourne and Brisbane & Perth is actually bigger than the gap that we had before the mining boom.
Part Two: Household to Income Ratio
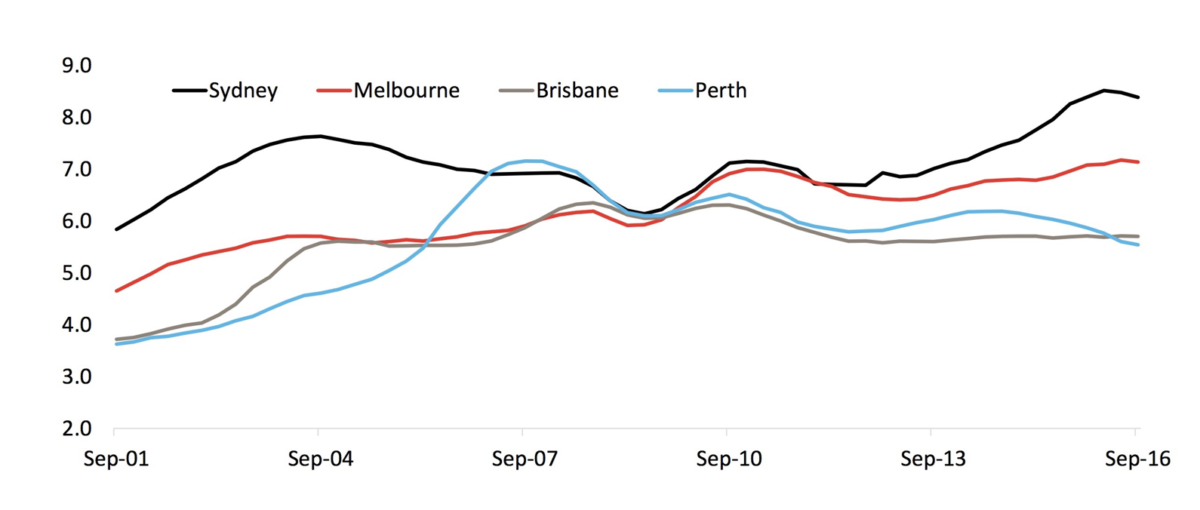

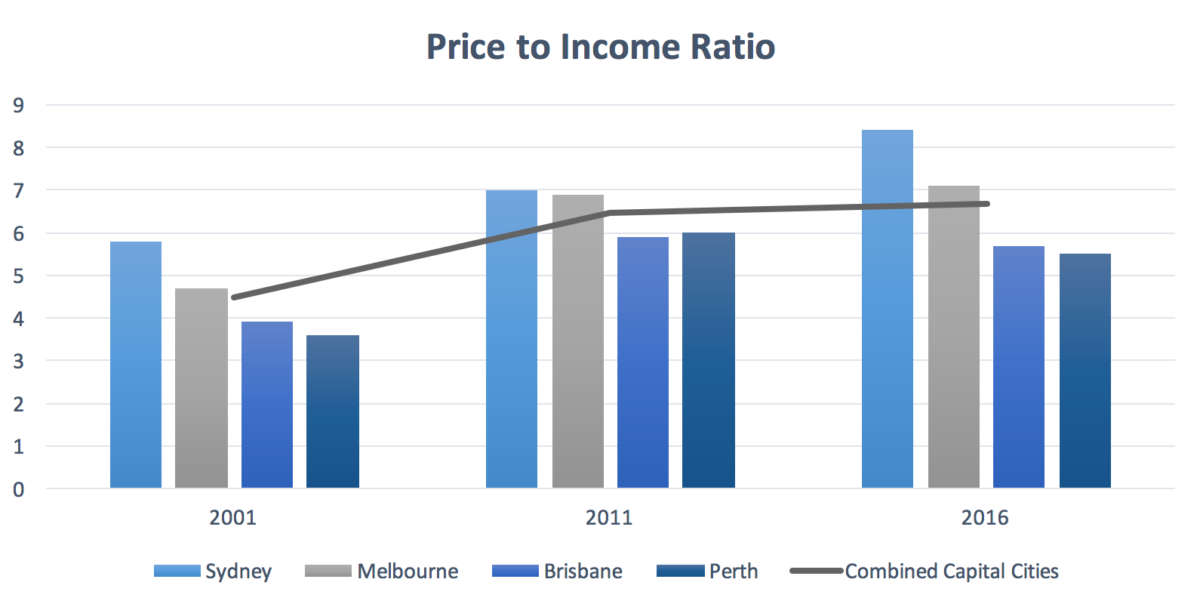
As shown in the Price to Income Ratio, all of the major capital cities have become significantly less affordable between 2001 and 2016.

However, when comparing the affordability ratio within these capital cities, it is clear that the gap among them now is very similar to the gap that existed in 2001, after the Olympic Games in 2000.
Part Three – Comparative analysis of the four capital cities against each other
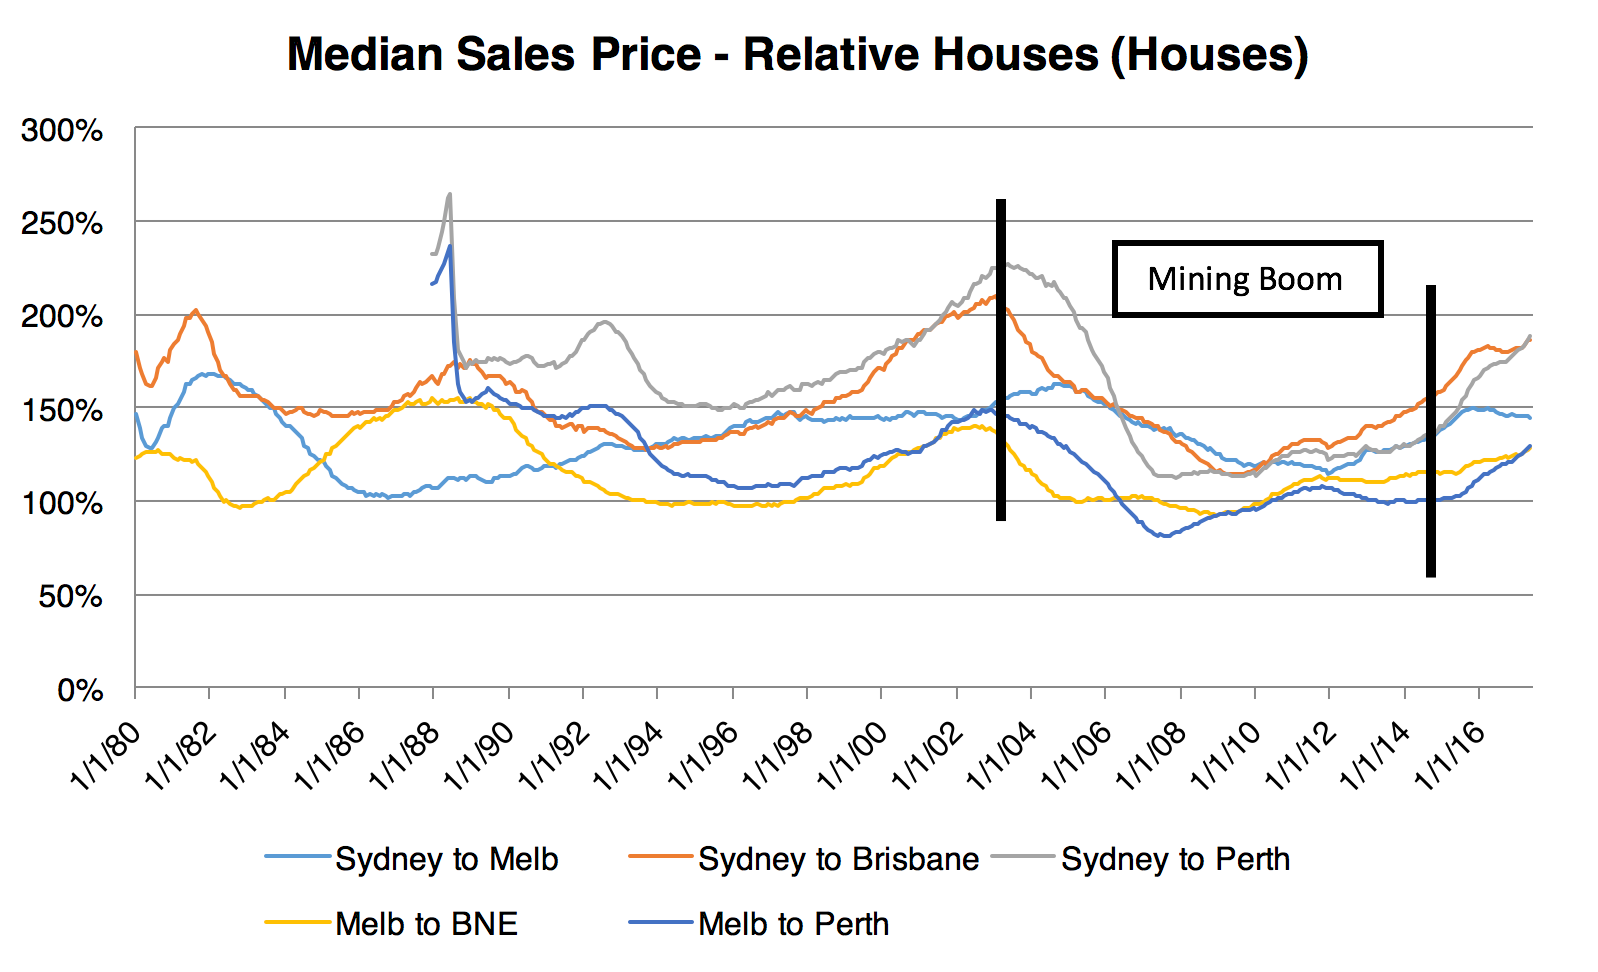
Results – Houses
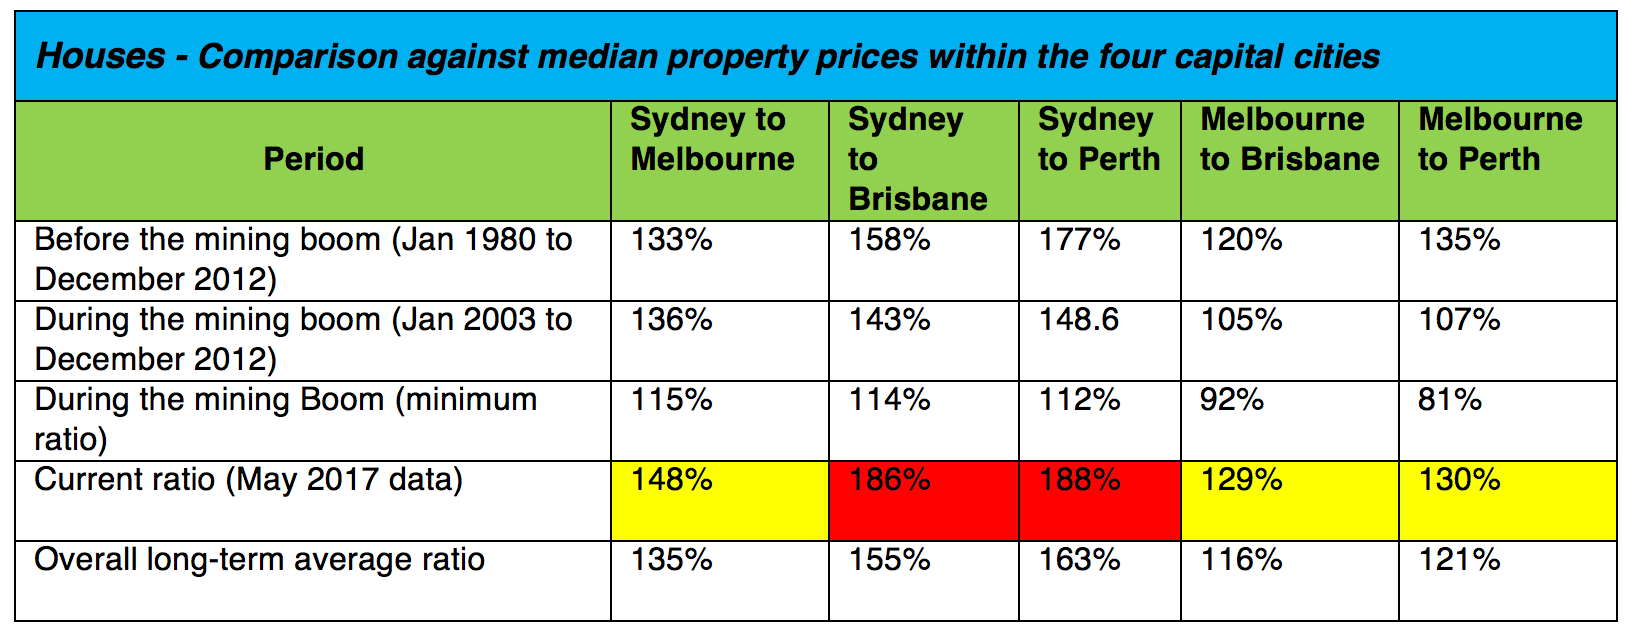
Prior to the mining boom:
Sydney house prices were significantly and consistently more expensive than the prices in Brisbane and Perth, with an average of 58% over Brisbane and 77% over Perth. In 2001, post Sydney 2000, Sydney’s prices were roughly twice as high as the prices of Brisbane and Perth.
While there was also a consistently noticeable gap between Sydney and Melbourne, this gap was smaller, with an average of 33%.
Interestingly, the gap between Melbourne to Brisbane was inconsistent. While overall Melbourne was 20% more expensive than Brisbane, during the 1990s the gap between these two capital cities was very narrow, and from 1993 to 1993 these cities were roughly on par.
During to the mining boom:
Unsurprisingly, during the mining boom the price ratios between Sydney & Melbourne to Brisbane & Perth have been changed significantly:
- In July 2009, Sydney prices had a median price of $470K, only 14% more expensive than Brisbane with a median house price of $412k.
- In November 2008, the median price in Greater Melbourne was $390k, about 10% cheaper than the median price in Brisbane of $425k.
- In August 2007, the median price in Greater Melbourne was $358k, about 20% cheaper than the median price in Perth of $440k.
After to the mining boom:
Not only has the gap between Sydney to Brisbane & Perth significantly widened, it actually exceeded the gap that existed before the mining boom. Currently, the median house price in Sydney is almost double the median prices in Brisbane and Perth.
This is also consistent with the analysis of the house to income ratio – the gap among the capital cities now is very similar to the gap that existed in 2001, after the Olympic Games in 2000.
However, a clear distinction should be made between Perth and Brisbane.
Perth
The gap between Sydney and Perth is slightly higher than the gap before the mining boom, and at this point of time and with the current economy, reflects the strength of the Sydney market versus the weakness of the Perth Market.
This means that, at this stage, Perth is NOT underpriced. The current dwelling prices in Perth reflect the estimated dwelling prices under ‘long-term normal market conditions’.
Brisbane
The gap between Sydney and Brisbane is significantly wider than the gap before the mining boom. Therefore, QLD appears to be more attractive than NSW as an investment destination. This conclusion gets additional validation from our research regarding investors activity (the Surplus/Shortfall Ratio), which shows that there is a very healthy ratio in Brisbane to support a sustainable investment activity.
However, the distribution of economic growth between the individual states in the coming years will determine whether we revert back to pre-mining conditions.
Sydney
The gap between Sydney and the other three capital cities is wider than the gap before the mining boom. Therefore, from a long-term perspective, Sydney’s houses are, therefore, more likely to deliver a lower capital growth, in the medium term. This conclusion gets additional validation from our research regarding investors activity (the Surplus/Shortfall Ratio), which shows that home loan rates would only have to rise 50 basis points – the equivalent of two Reserve Bank rate increases – to trigger an exodus of property investors from the Sydney housing market.
Melbourne
Very strong, sustainable capital growth in Melbourne that is supported by robust population growth, has positioned Melbourne significantly ahead of Brisbane to Perth. This trend looks set to continue, in the foreseeable future.
This structural change means that unless there is a very significant economic reform in the mining states, it is likely that the price ratios that existed prior to the mining boom will remain the ratios in the long-term. The transition from the mining boom is likely to bring us back to the ‘normal’ long term conditions, with the gap between Sydney and Brisbane in particular expected to diminish.
– RiskWise Property Review (www.riskwiseproperty.com.au)
